
Every growth team I've worked near has a dashboard. Impressions, sessions, CTR, keyword position, MQLs, spend by channel — all live, all colour-coded, all updated in real time.
Almost none of it gets opened by the people making budget decisions.
That's not a tooling problem. It's a translation problem, and it's one I keep watching teams solve backwards — by adding more metrics instead of fewer, better-chosen ones.
1. The dashboard is for the marketing team, not the business
Most growth dashboards are genuinely useful — to the people who built them. They're structured around the channels marketing manages, because that's the mental model marketing works in day to day.
The problem is the audience shifts the moment that dashboard leaves the marketing team's laptop. A CFO doesn't manage channels. They manage capital allocation. A dashboard built around channel performance is answering a question leadership isn't asking, using language leadership doesn't natively think in.
This is the gap I keep coming back to: the report is accurate, well-built, and still doesn't get read, because it was never designed for the room it's presented in.
2. Sessions are not a sentence a CFO can use
"Organic sessions grew 22% quarter over quarter" is a true, defensible statement. It's also not something a CFO can repeat in a board meeting, because it doesn't connect to anything the board is deciding on.
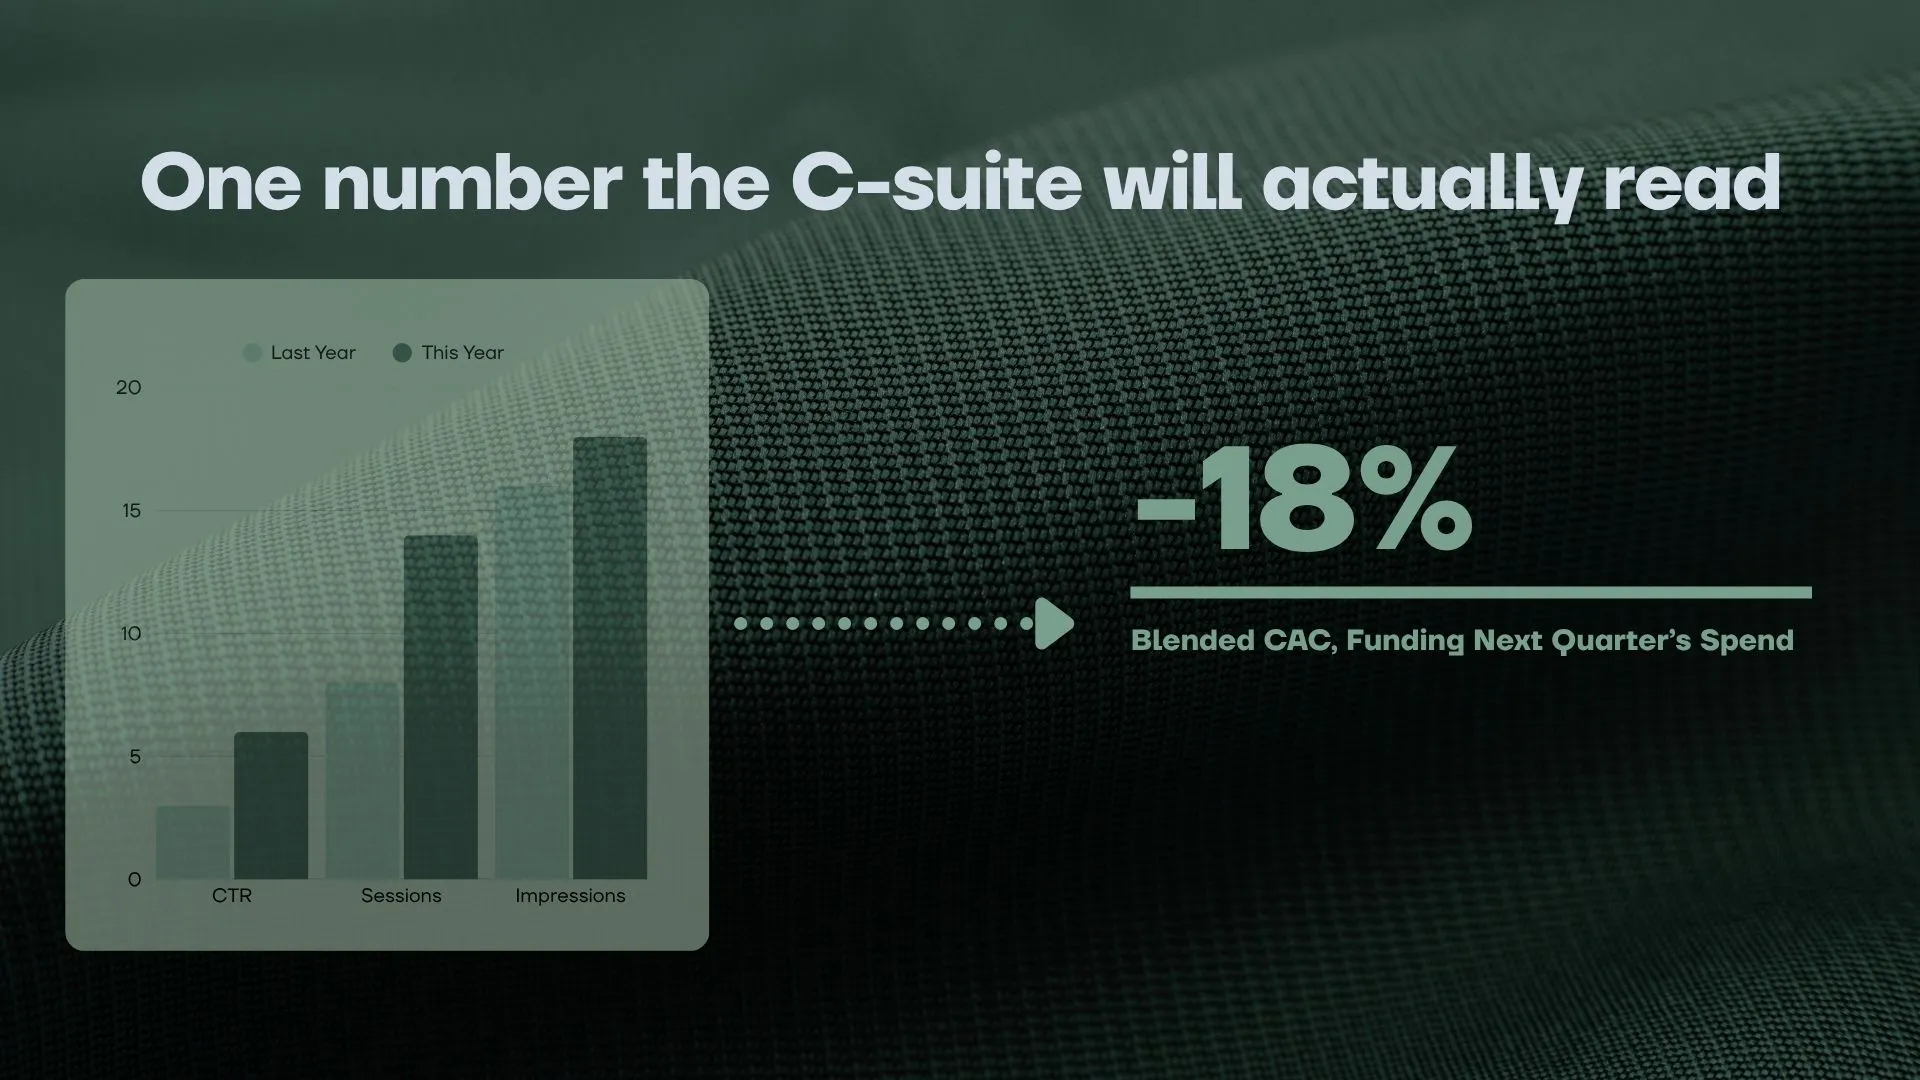
"Organic acquisition reduced blended CAC by [X], which funded [Y] in additional paid capacity without increasing budget" is a sentence a CFO can use immediately — in the board deck, in the next planning cycle, in the case for headcount.
Same underlying data. Completely different distance from the decision it needs to support. The gap between those two sentences is most of what separates a growth report that gets acted on from one that gets acknowledged and filed.
3. What actually gets read
The reports that consistently hold a leadership team's attention tend to share three things, regardless of company size or industry:
They open with the commercial number, not the channel number — revenue influenced, pipeline sourced, CAC movement — and only drop into channel detail after that headline, not before it.
They show trend, not snapshot. A single quarter's CAC means very little on its own. CAC trending down for three consecutive quarters while lead quality holds steady is a story leadership can act on.
They name the trade-off. Growth reporting that only shows wins reads as marketing. Growth reporting that says "this channel is compounding, this one has plateaued and here's why, this one needs more budget to prove itself" reads as a business partner making a case — which is a different kind of credibility entirely.
4. Building the version that survives contact with leadership
If your current dashboard is comprehensive but rarely opened outside the team, the fix usually isn't more data. It's a second, much shorter layer sitting on top of it — three to five numbers, framed in commercial language, updated on the cadence leadership actually reviews things (monthly or quarterly, not real time), with the full channel dashboard available underneath for anyone who wants to go deeper.
The full dashboard still matters. It's just not the artifact that earns marketing a seat in the budget conversation. The short, commercially-framed version is.
Build the version that gets read first. Keep the version that proves the work underneath it.